Smash burger
Mains · Last 7 days
Menu viewed
100%Category viewed
66%Product opened
33%Product added
22%Checkout started
17%Order placed
15%AI recommendationReorder Mains above Sides on the QR menu
Projected lift24%Trusted by leading hospitality brands



























What you get
Measure how often every menu item is viewed, added to cart, and ordered. Find the winners and the dead weight.
Run two menu configurations at the same time, in different parts of the venue, and let real guests pick the winner.
Watch the journey: scan, browse, modify, abandon, pay. Every interaction across QR, kiosk, click & collect, and POS.
See where attention concentrates, which categories carry the menu, and which items get lost in the scroll.
Visualize drop-off from menu view to paid order. Pinpoint the moment guests hesitate, then fix it.
Smart cross-sell and upsell prompts that learn from your guests, not a script. Lift basket without lifting a finger.
Margin, popularity, and price on one chart. Promote your best sellers, improve the weak ones, retire the items that lose money.
Orders, revenue, tips, refunds, inventory, conversion, all in one place. From any device, any location.
Conversion per product
Track view-to-order conversion on every dish, drink, and modifier. See which items earn their place, which need a new photo, and which are pure shelf space.
A/B testing
Show different menu configurations at different tables, kiosks, or pickup points at the same time. Real guests, real revenue, real verdict, in days, not quarters.
Menu heatmaps
A heatmap of every item, category, and section, showing real engagement: hovers, taps, scrolls, dwell time. Spot the items hiding below the fold and the categories doing the heavy lifting.
Ordering funnels
From the first scan to the paid order, see exactly where guests pause, hesitate, or leave. Then fix the step that costs you most. One change, measurable result.
AI upselling
Butlaroo learns from every basket. Pair the right side at the right moment, suggest the upgrade your guest is most likely to take, prompt the dessert when timing is right. No script, no training.
Customer story
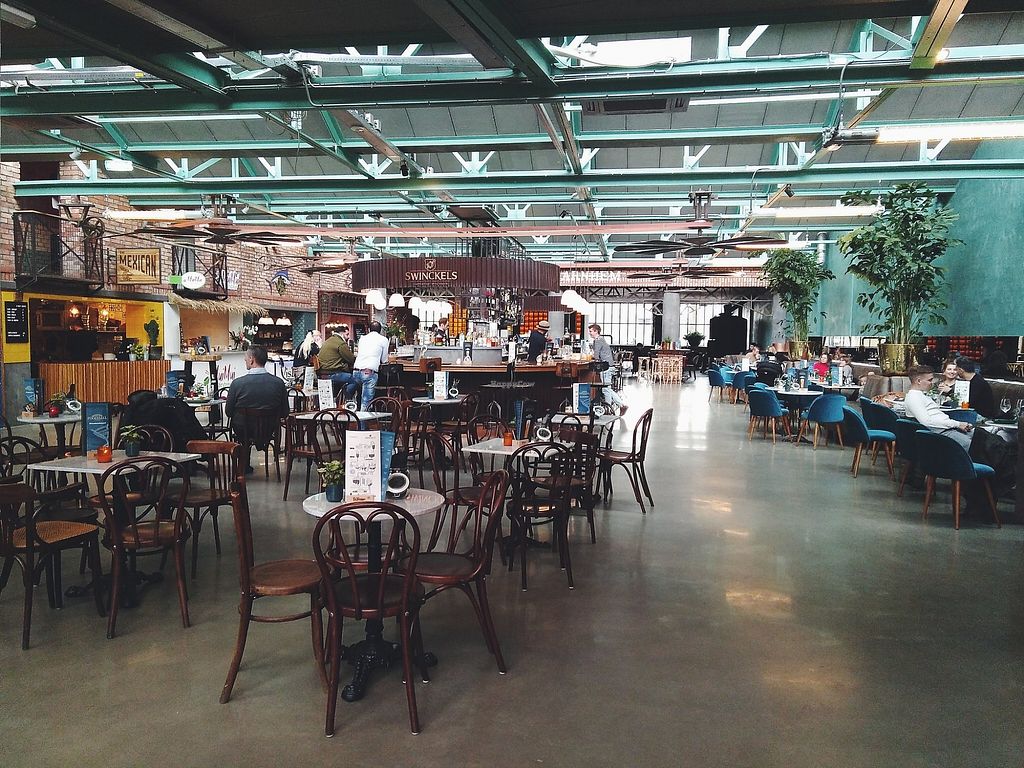
“The knowledge that everyone can simply order via QR provides peace of mind for the staff and actually creates space for offering additional service.”
Four areas, dozens of metrics. Switch on what you need today, layer in the rest as you grow.
QR, kiosk, click & collect, delivery, POS, broken down per shift.
Tip totals, percentages, and per-server attribution.
Volume, reasons, and impact on net revenue.
Disputed transactions tied to the underlying order.
Every signal exports cleanly to the systems you already use.






Every Butlaroo channel feeds Analytics in real time: QR ordering, kiosk, click & collect, delivery, POS, and Butlaroo Pay. If you run a third-party POS alongside Butlaroo, integrations cover it too. No manual exports.
Most venue-level tests reach statistical significance in 3-10 days at typical volumes. The dashboard tells you when you have a winner, so you don't roll out a decision on noise.
Item taps, modifier opens, dwell time on the item card, and whether the item ended up in a cart. Categories aggregate everything inside them. You can switch between raw counts and a 'per visit' view.
Yes. Slice by channel (QR, kiosk, click & collect, delivery, POS), per venue, by breakfast/lunch/dinner, or by guest group. Compare two slices side by side.
No. You set the rules: never upsell out-of-stock items, never push above a price band, never recommend allergens that conflict with the guest's filters. Inside those rails, the model picks the suggestion most likely to be accepted, learning from every basket.
Anonymized at the source. Analytics works on aggregated behavior, not individual guest identities. Your own POS guest profiles stay with you, and Butlaroo Analytics doesn't push them anywhere outside your account.
Yes. Daily CSV exports out of the box, plus a clean API for tools like Tableau, Looker, Metabase, and Power BI. Direct connectors are live for the most popular ones.
Pricing depends on your setup. See current rates and a quick estimate for your restaurant on our pricing page.
See pricingOne AI-powered restaurant OS to support all ordering channels & operations.












We use cookies to make the site work, to understand how it is used, and (with your permission) to personalize marketing.